Providing Engineering Visibility for the Board
Don't Re-invent the Wheel
Board and executive leaders are typically fluent at reading financials and understanding sales and marketing funnel metrics, but once you get into the guts of engineering, they often feel less grounded in terms of what to be looking for, and what good looks like. This can make board reporting for Engineering a challenge. To help, Jellyfish, the engineering analytics company, just released an updated Board of Directors reporting template, “6 Slides Every R&D Leader Should Show at Board Meetings.”
Platforms like Jellyfish are critical to supporting effective executive visibility into Engineering, especially since understanding the Engineering function is usually the farthest outside of the comfort zone of leaders from other functions. These tools let us select metrics that have broad industry acceptance so we can be certain that we’re measuring and presenting these metrics correctly. Plus, they serve as a resource to explain why these are the right metrics. After all, these products aggregate and amortize the work of selecting the right metrics across a wide range of teams.
Also, with visibility across a large customer population, engineering analytics platforms help us with benchmark stats about what good looks like. Even if someone doesn’t appreciate why having 90th percentile PR cycle time or deployment frequency is important, they can appreciate that being a top performer in widely accepted metrics like these is probably a good sign.
But reporting on the engineering function to the board is more than just throwing up a bunch of numbers. Even if the metrics look great, you’ll probably still get a big “so what” without also providing a healthy amount of narrative context. Metrics are necessary but not sufficient for effective board reporting.
So how should we approach this important topic? What data should we present, and equally importantly, how should we approach setting the narrative stage for that data?
Requirements Analysis
For starters, what does the board even want from our Engineering report? What do they want in general?
On a very high level, the board is there to “manage the management.” They act as the representatives of the investors in the company to oversee and ensure (1) that the CEO and management team have the right makeup, (2) that the CEO and management have a solid strategy for the company, and (3) that the company is executing well against that strategy. The board acts as the stewards of the investment placed in the company, ensuring that the value of that investment is being effectively managed.
These aspects of governance cascade directly to functional organizations. The board is asking these exact same questions about each function, including Engineering. Is the right leader in place? Do they have an Engineering and Product Strategy that maps clearly and effectively to the company strategy? And are they delivering? The challenge for Engineering is that, arguably more than any other organization, the board will have comparatively less direct intuition and experience with the domain. It’s just a fact that fewer board members come from an Engineering background, since fewer investors and CEOs come from that world. So more than any other organization, it’s up to us to not just bring the data, but bring it to life with a clear and compelling narrative.
Situational Awareness
The foundation for creating your board narrative is making sure you have strong situational awareness. What is the state of your organization and the company at large, and how does that map to your Engineering and Product strategy? To state the obvious, you may find yourself in very different contexts, and it’s critical that Engineering be goaled and managed in a situationally appropriate manner.
For example, as described in the famous a16z post you may find yourself in “peacetime,” driving growth on the foundation of a strong market position, or you could find yourself in “wartime,” fending off existential threats such as fierce competition, changing market conditions, technology disruptions, and more. Of course these situations will dictate very different postures, and the board will want to hear a clear narrative for how your Engineering plan and priorities map directly to the company’s contextually informed strategy.
Ideally, your product and engineering strategy should be in place and driving day to day priorities. This is among the most fundamental elements you can have in place to drive productivity. And ideally, board visibility to this strategy will be an ongoing topic, quarter after quarter, allowing you in most cases to take an approach of providing a quick refresh on the main themes, and mostly highlighting any key learnings and changes.
Starting with the strategic framing sets the stage for any details that follow.
Consider the Spider
Within the context of your strategy, a key board question will be, “Is Engineering positioned to advance that strategy effectively and efficiently?” In other words, assuming I buy your plan, do I believe you’re set up to execute that plan?
Of course, this can become a complicated question, since engineering organizations are complex systems doing complex work. It can seem hard to distill into a high level thumbnail. But a simplified yet insightful view is exactly what the board requires.
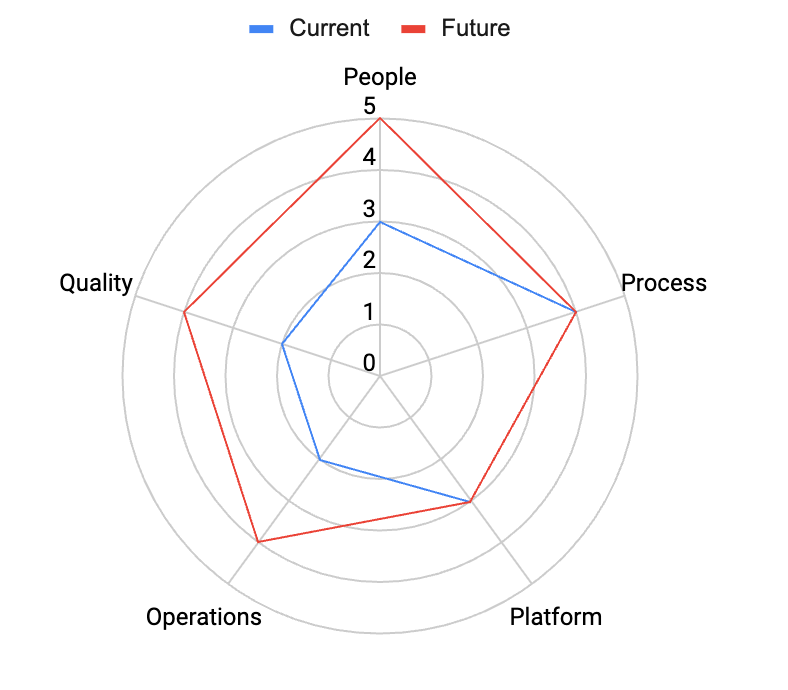
I’ve always liked to think about this in terms of a spider or radar chart. The dimensions of the chart are key high level aspects of the organization, certainly including key elements such as people, process, and technology, and adding in contextually relevant dimensions. For example, for SaaS or service oriented organizations, Operations (e.g., as measured by things like the DORA framework) is a key dimension. In many enterprise settings, dimensions like Quality and Security are often critical.
Imagine grading your organization on these key dimensions, both today, and where you want to get in the future (e.g., a one year view). You might depict this as a spider chart, with the bounds of the chart representing a world class organization, and your footprint showing your strengths and opportunities.
Having a view like this in mind, even if you don’t show a literal spider chart like this to your board, is valuable narrative grounding. It can help set the stage for what you’re trying to address. Is the organization weak on multiple dimensions, meaning you need to advance incrementally on many fronts? Are there one or two glaring issues, meaning that much of what you focus on and report on will be in those areas (e.g., a major tech replatforming, or a significant talent change)? Are you relatively strong across the board, meaning that you might be focused more on opportunities such as building out proactively for the next stage of scale (always a delightful position to achieve!)?
Depending on which of these situations you’re in, it can inform very different emphasis and focus for what you report, meaning the board can more quickly get what they need from a governance perspective, and you’ll be more likely to solicit relevant help and follow-ups.
Stylistic Approach
Even when we’ve nailed our narrative and have great data to provide, presenting to the board can be challenging since it’s so outside of the day-to-day, and so different from most internal interactions we have. We’re used to working with internal stakeholders who are “in the business.” They may not share all of our deep functional visibility, but they carry a ton of day to day business context, so communication is easier and more efficient. The board is simply operating at a greater distance, and doesn’t carry nearly as much detailed context. I’ve experienced this more directly now that I’ve had the opportunity to sit on a couple of boards. You’re relying on the leadership team to distill the salient information into a structure that you can quickly understand, and that helps you retain the key themes from meeting to meeting.
Some of the best advice I’ve seen in this area comes from Dave Kellogg, including his excellent general advice on presenting to senior executives. It pays to step back and consider the board’s frame of reference, and make sure that you’re efficiently meeting their needs. I know early in my career I made the mistake of thinking I needed to bring every detail proactively to ensure that I was clearly expressing my command of the business. But it is actually far more confidence instilling to demonstrate an ability to first distill the situation down to the salient points, followed by an ability to drill deep where needed.
Bring On The Data
So we’ve understood what the board needs from us, ensured that we have a solid strategic narrative that’s well aligned with the company strategy. Now it’s time to show our work, including data on the right level of operational detail. This is where Jellyfish’s recommendation does a solid job of providing a sensible template to work from.
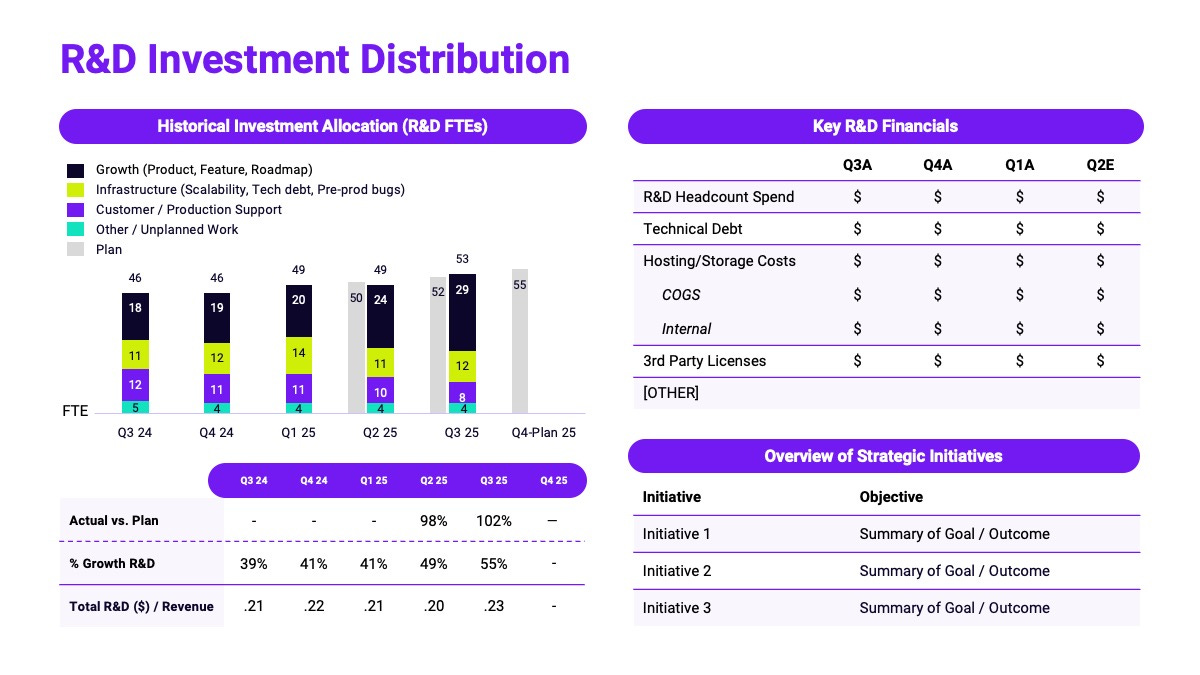
R&D Investment Distribution
The first suggested view shows the investment allocation of the organization. This is probably the view where I’ve had the most substantive discussions in actual board meetings over time – how are we investing and why? This includes breakdown into categories such as “growth” versus “customer retention” which often have a very direct connection to the business plan. And I’ve often added additional breakdowns, e.g., showing allocation by product line or onto certain strategic product initiatives, that directly clarify how engineering is balancing the needs of product strategy with other required investments such as support and maintenance.
It’s also wise on this slide to include key organizational initiatives. As described before, if you have set the table with appropriate engineering strategy context, these should illuminate the high level investments you’re making in the organization to effect the needed change.
Deliverables
Of course, no view of engineering is credible without a high-level look at key roadmap deliverables, both new items shipped in the prior quarter, and planned releases for the quarter ahead. The art in presenting deliverables is in achieving an appropriate level of detail for your scale and stage. As a simple heuristic, look for items that represent multiple percentage points of investment capacity, or that play a particularly important role in achieving the stated product strategy. And above all, make sure to develop labels or names for investments that assume little or no knowledge of the product details. Investment names need to be as self explanatory as possible!
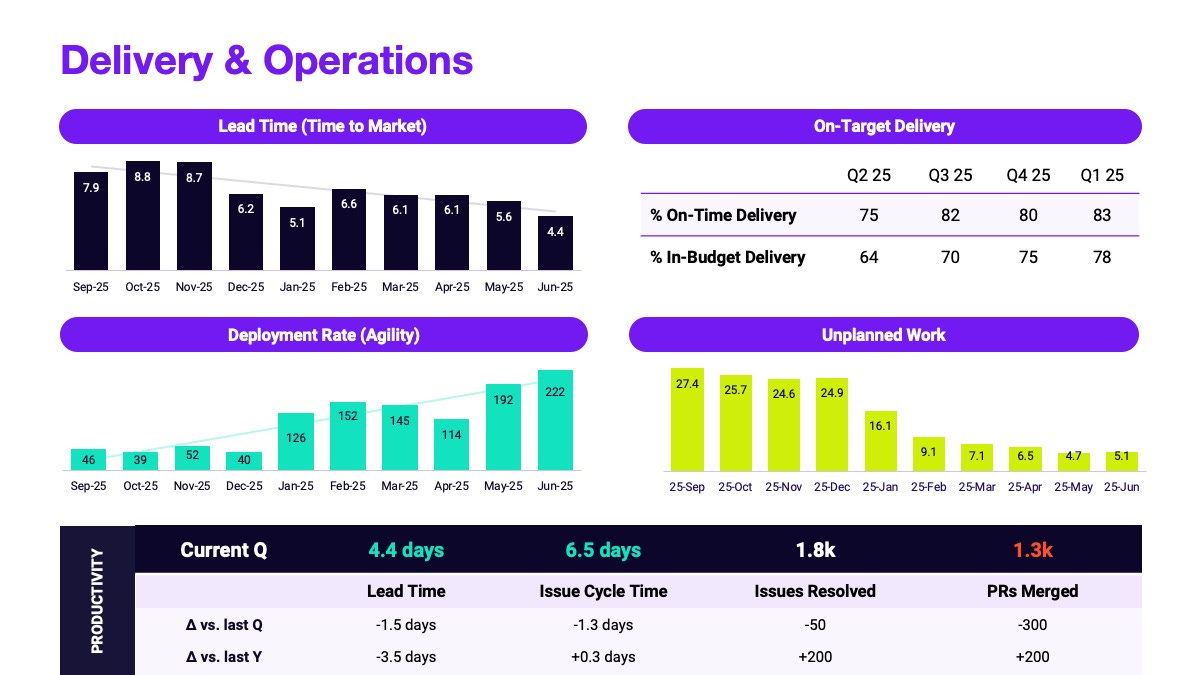
Delivery and Operations
A key question on the mind of most software company boards in recent years has been efficiency. Is the org productive and delivering value per dollar invested at close to the efficient frontier of other leading organizations? It’s a hard thing to measure directly, since every product and every organization is different. But fortunately, the industry has arrived at fairly well established proxies for productivity. The DORA organization has been a leader in studying these, looking at the strong relationship between metrics like lead time for changes and deployment rate and high-level business outcomes.
Quality
Having explicit and thoughtful data on Quality is essential in most software settings. Quality is often a charged topic because when customers hit quality issues, it can shake confidence and increase real business risk, all of which can lead to charged emotional reactions. Trends are hard to spot from gut feel alone, especially when emotions are high. Combine this with any related factors, such as delays in customers going live, high profile cases of churn, etc., and it can often lead to an unproductive discussion. Having a strong handle on quality – metrics such as change failure rate, uptime, and mean time to recover (MTTR) – are essential to convey that the engineering org has a strong handle on where quality stands. This in turn is the foundation for explaining investments in quality, which trade off against roadmap progress.
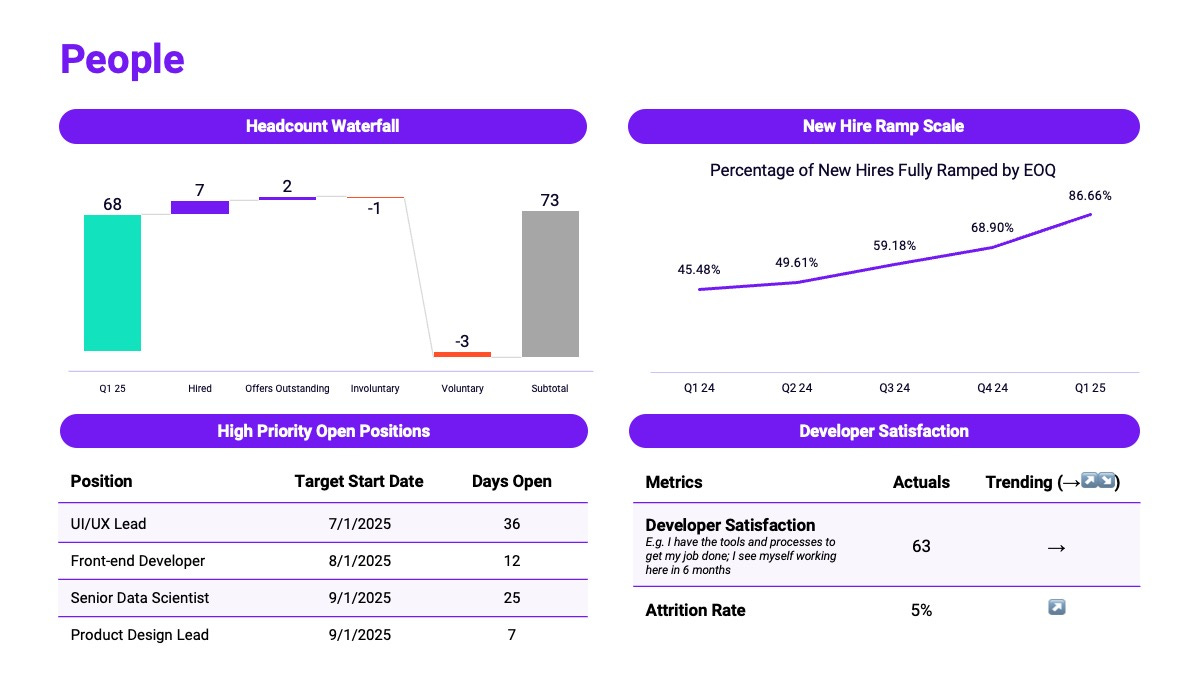
People
Of course, talent is absolutely central to any engineering organization. Providing a view of people operations including headcount status, hiring, and ramping, as suggested in the template, are good fundamentals to include. Also as depicted, developer experience scores based on regular engineering surveys have become a well established best practice. In addition to these core measures, it’s worth refreshing on key org structure changes, especially when any big updates are in the works. And beyond just structure, showing organization makeup along key dimensions such as seniority, discipline (e.g., UX, backend, data engineering, DevOps, etc.), and geography can be helpful, especially if changing your talent mix in specific ways is a part of your overall engineering strategy.
Introducing AI Impact
The five areas discussed so far – Investment, Deliverables, Operations, Quality, and People – are well established pillars to build around. But at this moment, it would be impossible not to also include specific coverage of the impact of adopting AI into the software development process. Just a year ago it seemed that board expectations were generally that engineering leaders should be experimenting and figuring out how to get leverage out of AI. But over the past year, with numerous reports of organizations seeing strong gains from AI-assisted development, expectations have moved significantly. At this point, boards are expecting to see production use of AI in the software process, and measurable impact, even if the results are not yet amazing.
While approaches for quantifying AI impact are still evolving, there has been some good progress on frameworks, such as the Jellyfish AI Impact Framework which clearly informed the recommended template here. These frameworks have converged on looking at three levels of AI impact in software development:
Adoption
Engineering Productivity
Business Impact
We see these three levels of visibility in the suggested template. Showing adoption (are engineers using the available tools) alongside engineering impact such as PR cycle time and defect rate, is essential to show that you’re in the game, removing barriers to engineers using and benefiting from the tools. Perhaps even more important, showing a reasonable proxy for business impact is essential, which is the role of the Capacity Impact view on the template. This shows our per-capity issue completion rate – effectively, how much more business output are we getting with the same team.
Finally, at the top of the template we see space for program initiatives. This is our opportunity to expose that adopting AI in the SDLC is not like flipping a switch. We need to methodically experiment with different tools, various enablement approaches, and in various phases of development. For example, you might be highly adopted on an AI assistant like Github Copilot, while also piloting more agentic development with a tool like Claude Code, and also starting to route some code review workload to an AI agent. Exposing this roadmap shows a thoughtful engagement with this transformational space.
I expect we will see best practices for showing AI impact evolve in the coming year. For example, I believe it’s highly likely boards will want to see measures of financial efficiency in this area, especially since a huge part of the benefit should be unlocking greater productivity and output per overall dollar of R&D investment.
Finally, Appreciate The Moment
Starting with a solid template like the Jellyfish deck is a great help in avoiding having to DIY a bunch of data design that’s already been done many times over. It means you can focus on the really important part, the narrative framing. If the narrative is strong, and if it is well aligned with the company / CEO narrative and other functions, the data tends to be an opportunity to express strong command of the organization’s strengths and challenges, with investments clearly aligned to advancing in thoughtfully considered directions.
If you’ve spent any time on exec teams, you realize there isn’t really any singular “room where it happens.” It can be a disappointing revelation after spending a career working to get a proverbial “seat at the table.” But there are an interlocking set of rooms where it happens, and the board meetings are definitely a part of that. I’ve always appreciated participating in those discussions. It’s worth stepping back and appreciating being part of important conversations that help guide the evolution of your company.
Ideally your CEO is working actively with the board ahead of meetings to ensure that surprises are minimized and discussions are as productive as possible. But unavoidably, sometimes the setup is less than perfect, and the discussion can be more heated. Generally speaking, except in outlier cases, everyone is there to ensure the best possible outcome for the company. Even when it is heated, it’s a rewarding experience.


