
Quantifying AI Coding Impact
A deep dive into vendor native data


In an interview at Meta's recent LlamaCon, Microsoft chief Satya Nadella casually dropped some major bombs about the level of impact AI coding assistants are having at his company. Nadella estimated that the acceptance rate for AI generated code completions was something like 30-40% and rising. And, he stated that in some repos, especially in newer and more modern areas, the absolute amount of code generated by AI is as high as 20-30%.
That’s pretty stunning, even if you don’t buy into the crazy interpretation that this somehow means that 30% of all of the code at Microsoft now has AI provenance. If you listen carefully, there’s no way that Nadella meant this, but nonetheless the amount of impact he’s talking about is pretty wild!
These stats out of Microsoft set off a bit of a brush fire in tech.
Armed with Nadella’s talking points, Boards and CEOs are more aggressively asking engineering leaders how they are quantifying AI impact on software development, and, specifically, what kinds of results they are seeing. Also, the idea of “how much of the code was written by AI” seems to have caught on as the impact metric for the moment. Perhaps it’s not surprising. After all, it’s easy to understand, and intuitively does seem to provide at least some basic insight into quantifying the impact of AI coding. But surely this metric is not the endgame. I mean, when was the last time you ranked your human developers based on “git blame”?
The State of Measuring Impact
The recent rise of AI coding tools has rapidly increased the pressure on strategies for measuring Engineering productivity. The use of AI in software development is probably the biggest productivity game changer since the introduction of high level programming languages in the mid 20th century! And software organizations are understandably very interested in understanding what productivity gains are being seen from AI, both across the industry and localling in their own team.
The good news with respect to productivity metrics is, although there isn’t complete agreement, there are emerging proposals for standards that are gaining greater acceptance. For example, probably the best known standards are DORA and SPACE. And just last week Github released their Engineering System Success Playbook. All of these frameworks are arriving at some similar conclusions, including factors such as flow metrics like cycle time, quantity of activity and work like PR volume, developer experience measures gathered by surveys, and quality measures like change failure rate. Having clarity on the metrics that matter to productivity means we can look at a new factor such as AI tool usage, and consider how that correlates with these measures.
A second bit of good news on this front is that the Engineering metrics platforms (often referred to as Software Engineering Intelligence (SEI) Platforms), such as Jellyfish and DX, are increasingly making measuring the metrics that matter a lot easier and more reliable to see. Leaders in this space clearly see the importance of being able to concretely inspect the impact of AI. Jellyfish, in particular, has been rapidly evolving an AI impact dashboard to show the impact of AI usage on various productivity metrics.
The Engineering metrics space is evolving quickly to arm engineering leaders with the tools and analyses they need to answer the burning questions they are getting around AI impact in their organizations. But it’s also quite early in the going, and it’s clear that we’re not yet close to the endgame for measuring AI impact, especially given how fast the art of coding with AI assistance is moving.
Native AI Coding Metrics
So what can Engineering leaders do right now? An important part of the answer lies in leveraging the data provided directly by the underlying AI coding tools. Doing this has two important benefits:
First, data available directly from the tools is the highest resolution, most detailed view that you can get at the moment to show at least directional AI impact.
Second, as SEI platforms quickly add higher level and more end-to-end views of AI coding impact, the underlying data around AI coding activity will still need to come from the underlying tools themselves. So looking at the native analytics from these tools provides a hint about what kinds of data will be part of the bigger picture in SEI platforms in the future.
So let’s take a look at some representative examples of what these tools are providing today…
GitHub Copilot
The AI coding assistant space is moving insanely fast, with new tools emerging constantly, and new capabilities and features landing in existing tools on what seems like a weekly beat. But despite all that massive innovation, it’s pretty clear that Microsoft has the leading position in the space, with over 1.8 million paid subscribers and over 77,000 enterprise customers, growing at a rate of 180 percent year-over-year. They certainly can’t rest on their laurels, but they’ve jumped out to an enviable position in the market, with many Engineering leaders standardizing on Copilot as a safe choice, well integrated into the Github suite, and likely to track new features from competitors as they are imagined.
So what is this market leader providing in terms of metrics and impact data? The GitHub team made their metrics API generally available back in October, and provided solid doc to go with it. The metrics model looks at three types of high level activity:
Usage of Copilot in IDEs (e.g., Neovim, VS Code, Jetbrains) for code completion suggestions
Usage of Copilot Chat interfaces (either in IDEs or in the copilot.microsoft.com chat interface
Usage of Copilot to create PR summaries
The data provided within each area focuses on two main concepts:
Usage: How many engaged users there are on a given day for the feature in question, where being an engaged user means you used the feature at least once during that day.
Activity: For the feature in question, how much was that feature used? For code suggestions, this means providing data about how many suggestions were made, and how many of these were accepted, as well as how many lines of code were suggested, and how many of those were accepted. For chats, the API indicates how many chats occurred, and how many times code was accepted based on the chat. And for PRs, it’s simply a measure of how many PR summaries were created.
In addition to overall usage and activity metrics, the API breaks down these metrics based on the specific environment. For example, the IDE metrics can be looked at overall, or broken down based on which specific editor is in use, which specific model is in use, and which programming language is in use. So the data provides the needed granularity to see specific trends in adoption and impact. In other words, when Satya Nadella says he’s seeing impact from the C# and Python engineers but not the ones working in C++, it’s plausible that he’s basing those assertions on real data from this very API.
Here’s an example of the GitHub Copilot Metrics Dashboard, a publicly available app to visualize data from the GitHub Copilot Metrics API:

Cursor
If there’s a “top challenger” to the dominance of Copilot, it’s probably safe to say that as of this writing, Cursor wears that crown. I’ve had numerous discussions with Engineering leaders who may not have standardized on Cursor, but it’s one of their supported choices for the team. And I’ve talked to others where Cursor is being used on the ground even if it hasn’t been formally adopted by the org yet.
So far, Cursor has provided a fairly bare-bones metrics interface, but they have been evolving it rapidly in recent days to provide both a more visual and interactive UI as well as an API. While it’s safe to expect that what they offer in this area will move quickly, at the moment, the data they provide is similar in spirit to what Copilot offers in that it also considers Usage and Activity.
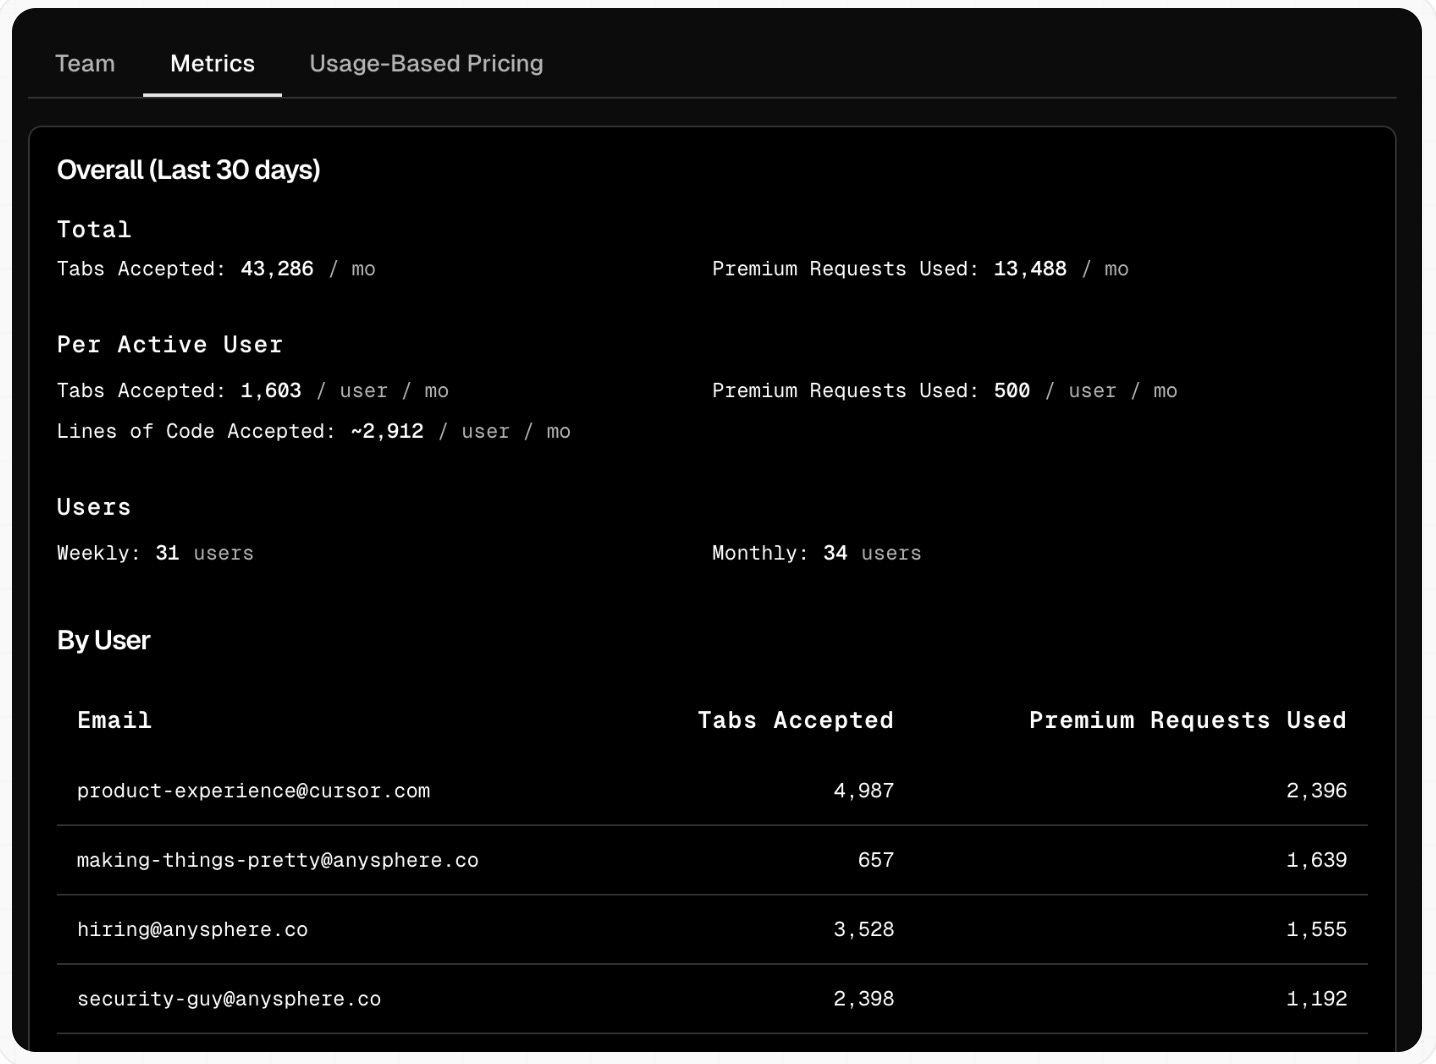
In particular, the Cursor metrics page shows overall “active user” usage stats across the org, as well as activity such as Tabs (code suggestions) accepted and lines of code accepted. The current UI also gives these activity stats broken out by users, so you can do things like spot who are the “power users” making the most use of the tool. And some early previews seem to indicate that soon you’ll be able to also break down the data along other relevant dimensions such as programming language and LLM model in use.
This is an example of the current Cursor “team metrics” dashboard:
Windsurf
For many, Windsurf is perhaps the next name in AI coding that comes to mind, and it’s been in the news since their potential acquisition by OpenAI came to light.
Windsurf is an interesting standout in the space of AI Coding impact metrics. Unlike many other tools that have followed a basic “usage and activity” approach like Copilot, Windsurf has been ambitious in investigating deeper metrics that actually shed light on real impact.
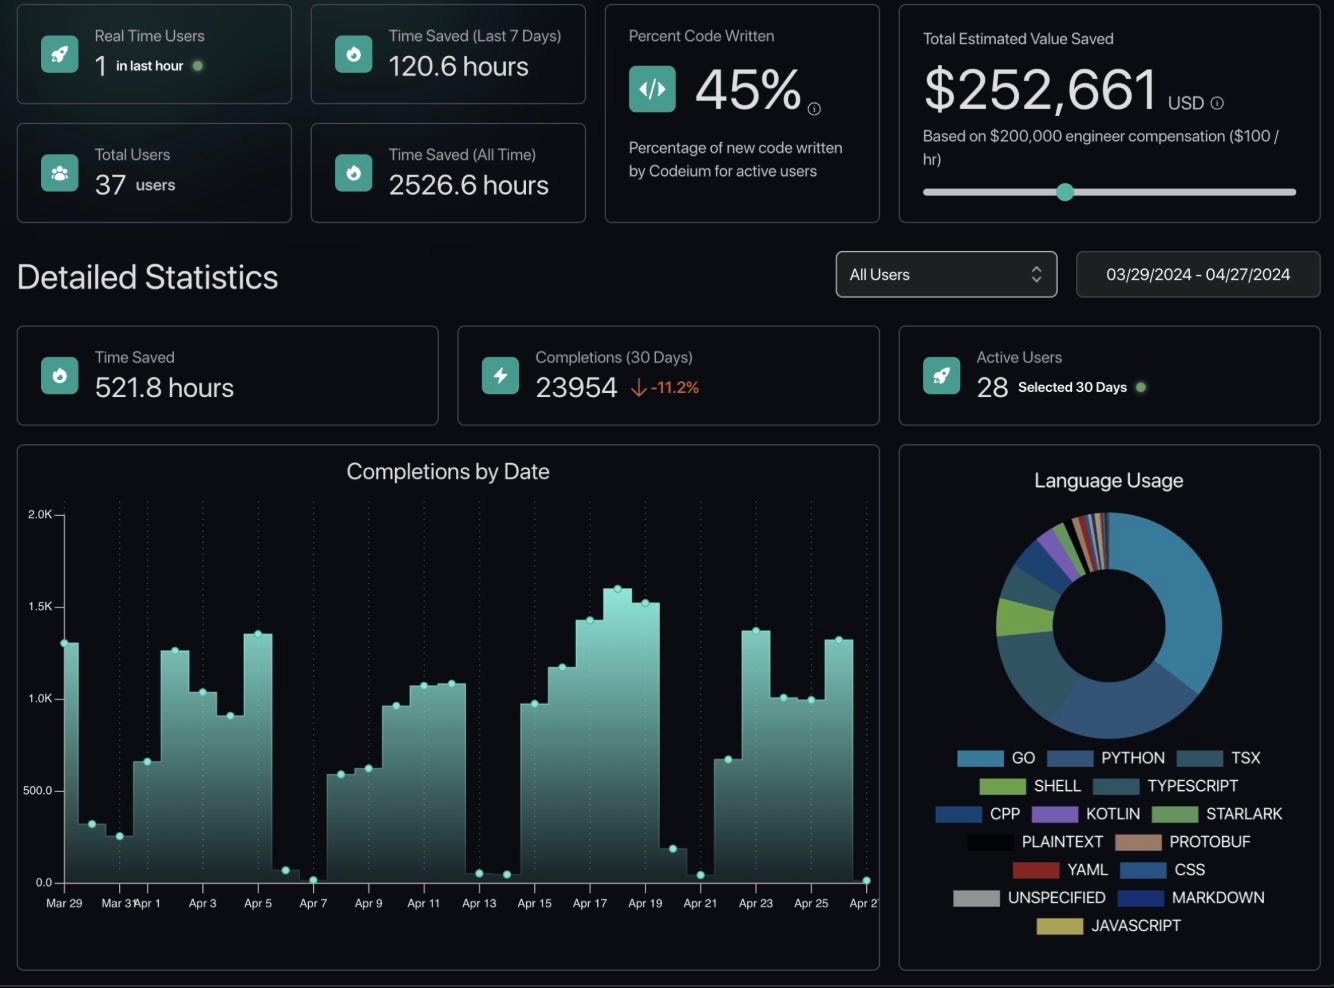
Windsurf provides a highly interactive dashboard to access their metrics. This interface does provide the basics of usage and activity – you can see the active users and accepted completions by date, for example. And as in other environments, these can be sliced by dimensions like programming language or model.
But Windsurf also provides value-oriented metrics, including:
Percent of Code Written by AI: Using a strict definition of lines that were purely generated by the model versus requiring any change from the human user.
Time saved by AI: An estimate of how many developer hours were saved based on the automatically generated changes.
Dollar value saved by AI: A translation of time saved into money, using a simple adjustable assumption about average developer salaries.
Even with their differentiated and thoughtful take on AI impact metrics, the Windurf team also clearly sees the limits of what can be done within the confines of the coding tool itself, since coding is only one part of the value creation process. They write: “It should also be clear why PCW (percent of code written) is not actual productivity! Unfortunately, in marketing materials, many code assistant vendors muddle metrics such as acceptance rate with value propositions such as developer productivity, but we understand the limitations of the metrics that we display."
This is an example of the Windsurf dashboard:
Amazon Q Developer
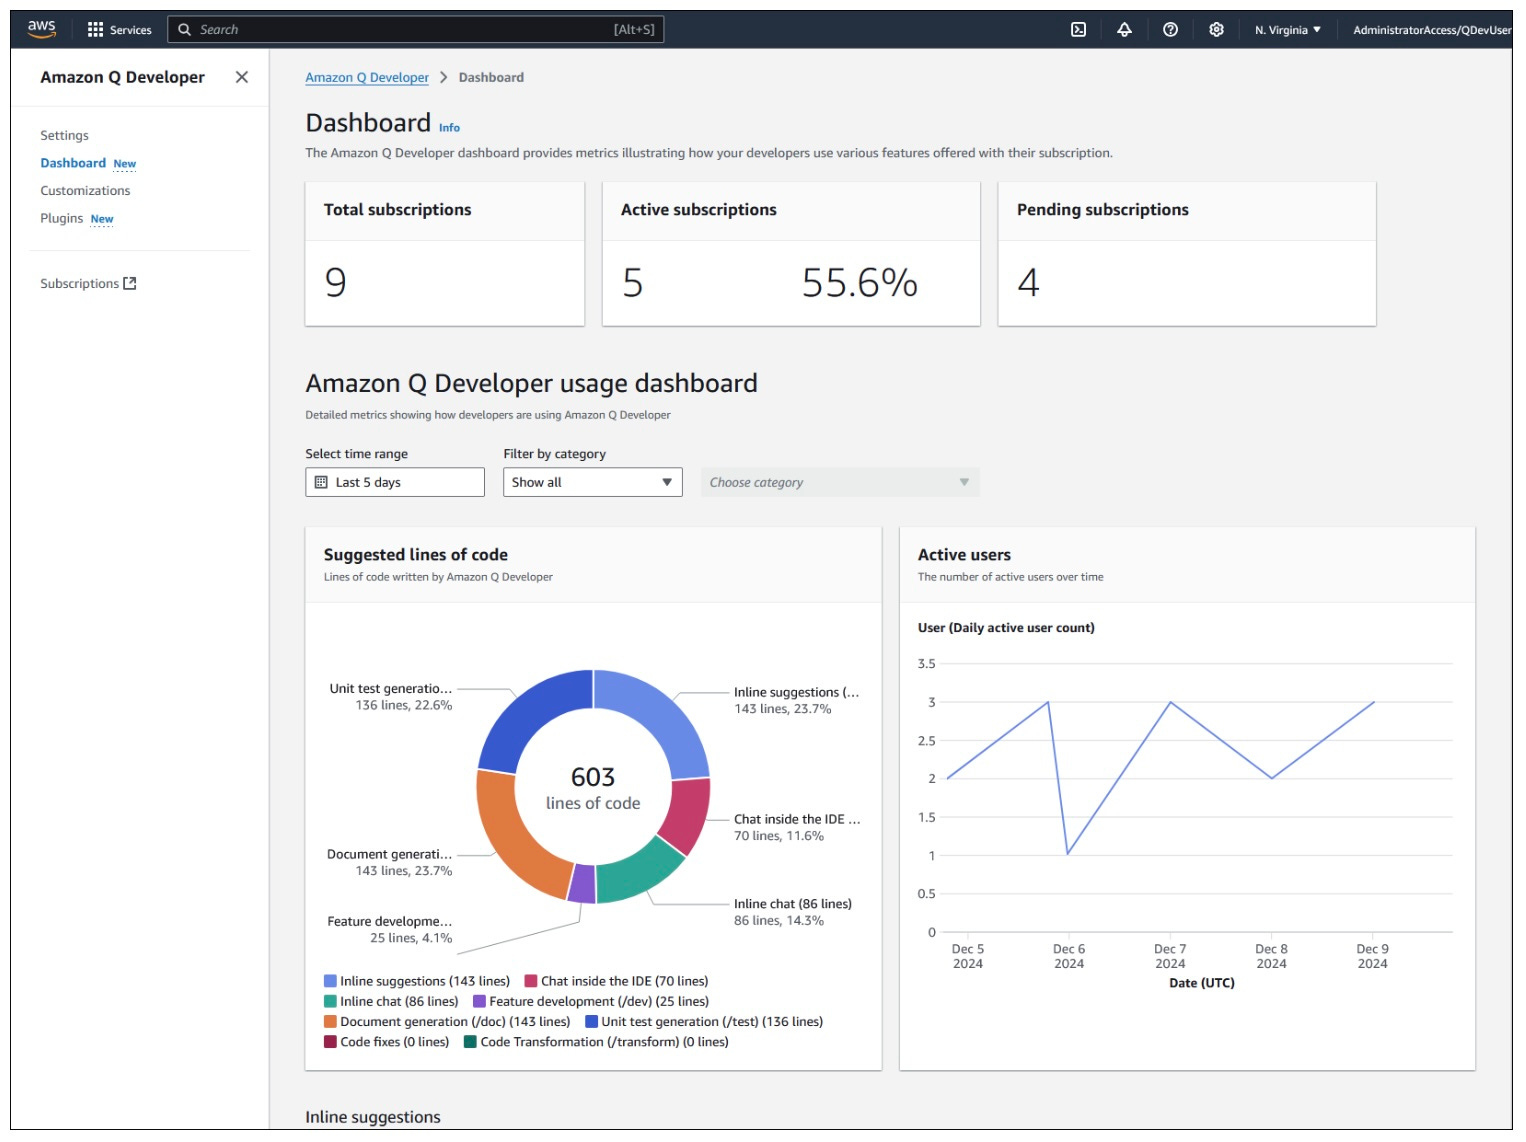
Amazon Q provides another good example of an AI coding offering from a major vendor. In terms of metrics, Amazon so far has stuck to the basics, showing usage (licenses, active users, etc.), and mainly focusing on activity (e.g., lines of code accepted) and acceptance rates related to their core feature set.
These are the metrics provided, either in the UI or via export into an S3 bucket:
Active users
Accepted lines of code
Inline completion suggestions made / accepted
Inline chat suggestions made / accepted
Standalone chat responses
Feature development volume and acceptance rate
Document generation volume and acceptance rate
Unit test generation volume and acceptance rate
Code reviews findings volume and acceptance rate
Code fixes volume and acceptance rate
Code transformations volume and acceptance rate
Here we see an example of the Amazon Q Developer dashboard:
What’s Next?
The above examples give a good sense of the state of the art of what is provided by individual vendors. It’s an open question whether these kinds of details will be enough to show impact, even when combined with a more complete view of the development process, e.g. in an SEI platform. It’s easy to step back and see additional details that might be important. For example, while most tools provide aggregate numbers about code suggestions and acceptance rates, and break these down on a time basis (e.g., daily), they don’t break things down to the level of a PR. Might it be helpful to understand the percent of code in a given PR that was AI generated to correlate with PR cycle time, or is the aggregate data good enough?
And certainly, wherever the source data lands, it’s clear that the real story of AI coding impact will only be truly visible at a higher level than individual coding tool metrics can provide. That visibility is likely to play out in the SEI platform domain.
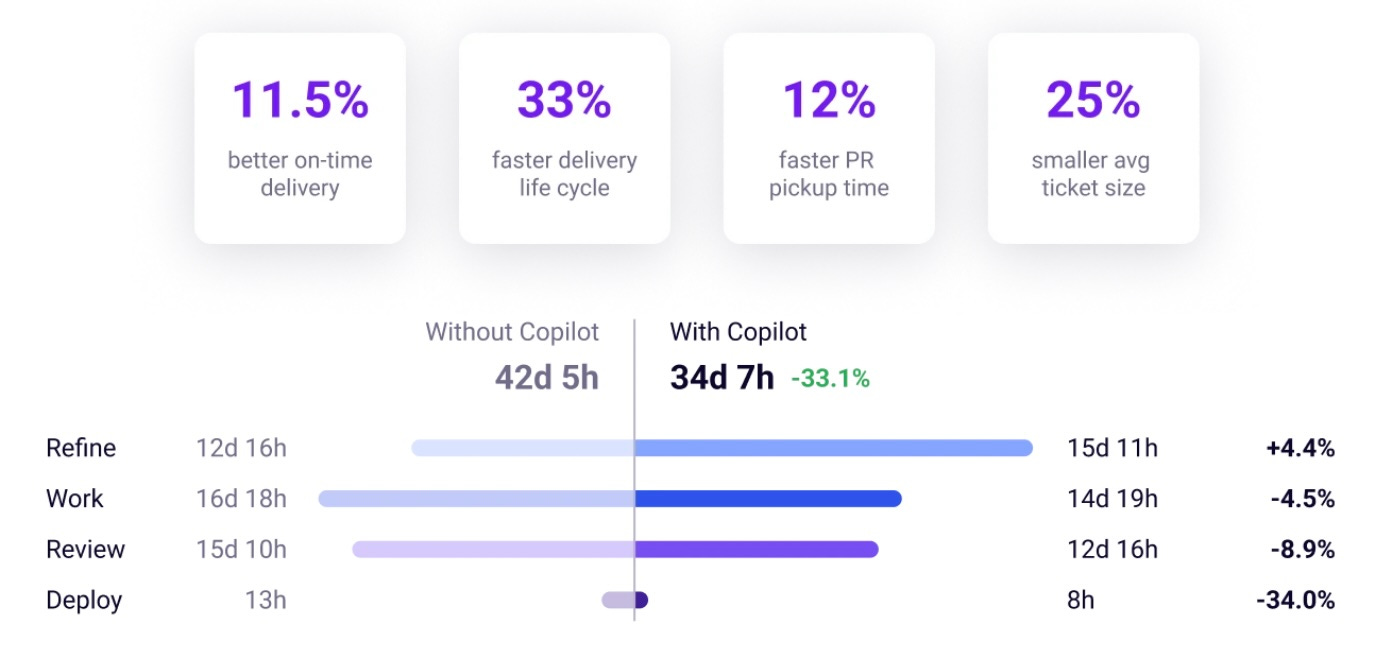
For example, below you can see the Jellyfish AI Impact dashboard. Compared to what the native analytics from AI coding tools can show, here we see higher level analysis of the impact on the larger development lifecycle, including business-relevant metrics such as on-time delivery rate. Other parts of the dashboard show how AI coding impacts strategy concepts such as effort allocation (e.g., percent of capacity directed towards innovation).
What will this mean for the evolution of data being provided by AI coding tools?
Metrics APIs
As we can see in the Jellyfish example above, the real value of AI Coding usage data will come from integration with data from other engineering systems, pulled together in business-relevant views. For example, what does AI usage mean for metrics like delivery predictability or higher level ticket cycle time (e.g., at the epic level)? This need to see the data in the larger context will mean that APIs for data from AI coding tools will be a table stakes feature, even if these tools provide nice interactive dashboards of their own. For example, we already see tool vendors like Cursor adding APIs for this data to make it available for external analysis.
Standardization
It’s great to see tool vendors like Windsurf engaging so deeply on the question of meaningful AI coding metrics. But it seems likely that most environments will adopt a heterogeneous set of tools. For example, we already see a common pattern of orgs where some engineers gravitate towards using newer AI-native UIs, while some experienced devs want to stick with a tried and true IDE such as Jetbrains. It’s clear that in order to see the big picture, some level of normalization will need to be brought to the available data. I could imagine this playing out at the SEI level, with SEI platforms normalizing data to the extent possible in their data pipelines. But it’s also possible that we will see some industry standards emerge, which would be great in terms of ensuring a baseline level of visibility across systems.
Longer Term
Today we are largely relying on metrics dashboards from AI coding vendors to assess impact, but we can see just over the hill to a world where SEI platforms provide a higher level view that harmonizes with the larger picture of overall engineering productivity. But is the end of the story? If AI is changing the very nature of software development, not just productivity, doesn’t that imply that the very nature of SEI may need to change too?
In particular, SEI tends towards a human-centric view of a software organization. But it’s pretty safe to assume that beyond coding assistants, as well as assistants for other human software development tasks such as writing documentation, reviewing PRs, etc., we’re likely to start to see true agent-based activity in the software process. These agents will act more and more like additional human engineers, perhaps initially focused on specific tasks or code areas, but increasingly able to autonomously select and execute work. I don’t think anyone is predicting that humans will go away, but that there will be some shift in the human workload.
In this agentic future, what will SEI look like? With models and agentic capabilities evolving so quickly, I expect we might see analytics that help us understand our larger organizational strategy, such as understanding the right balance between salary spend and spend on agentic compute. We might also ask what the right mix of agents and tools looks like. And, are we near optimal in terms of our productivity per dollar spent on software engineering? On the human side, do we have our people focused on the best types of work, not only to maximize our productivity, but also to set them up to evolve their skillset into the highest value and most durable competencies the industry will need from its people in the evolving landscape?
It promises to be an exciting ride, and one that I’ll be watching closely!
Coming to this late but the metrics question is even more pressing now. Cursor just crossed $2B in ARR with about 300 employees. That's roughly $6.7M in revenue per employee. The native tool metrics you cover here tell one story but the financial metrics tell quite another. I wrote up the gap between perceived productivity and actual economics: https://sulat.com/p/cursor-just-hit-2-billion-arr